Solana Price Prediction: Solana has been trading around the $84 mark over the past week amid analysis of the tightening of its market structure at higher time frames. Its price was under the significant resistance levels while its ability to maintain the current support levels was being observed.
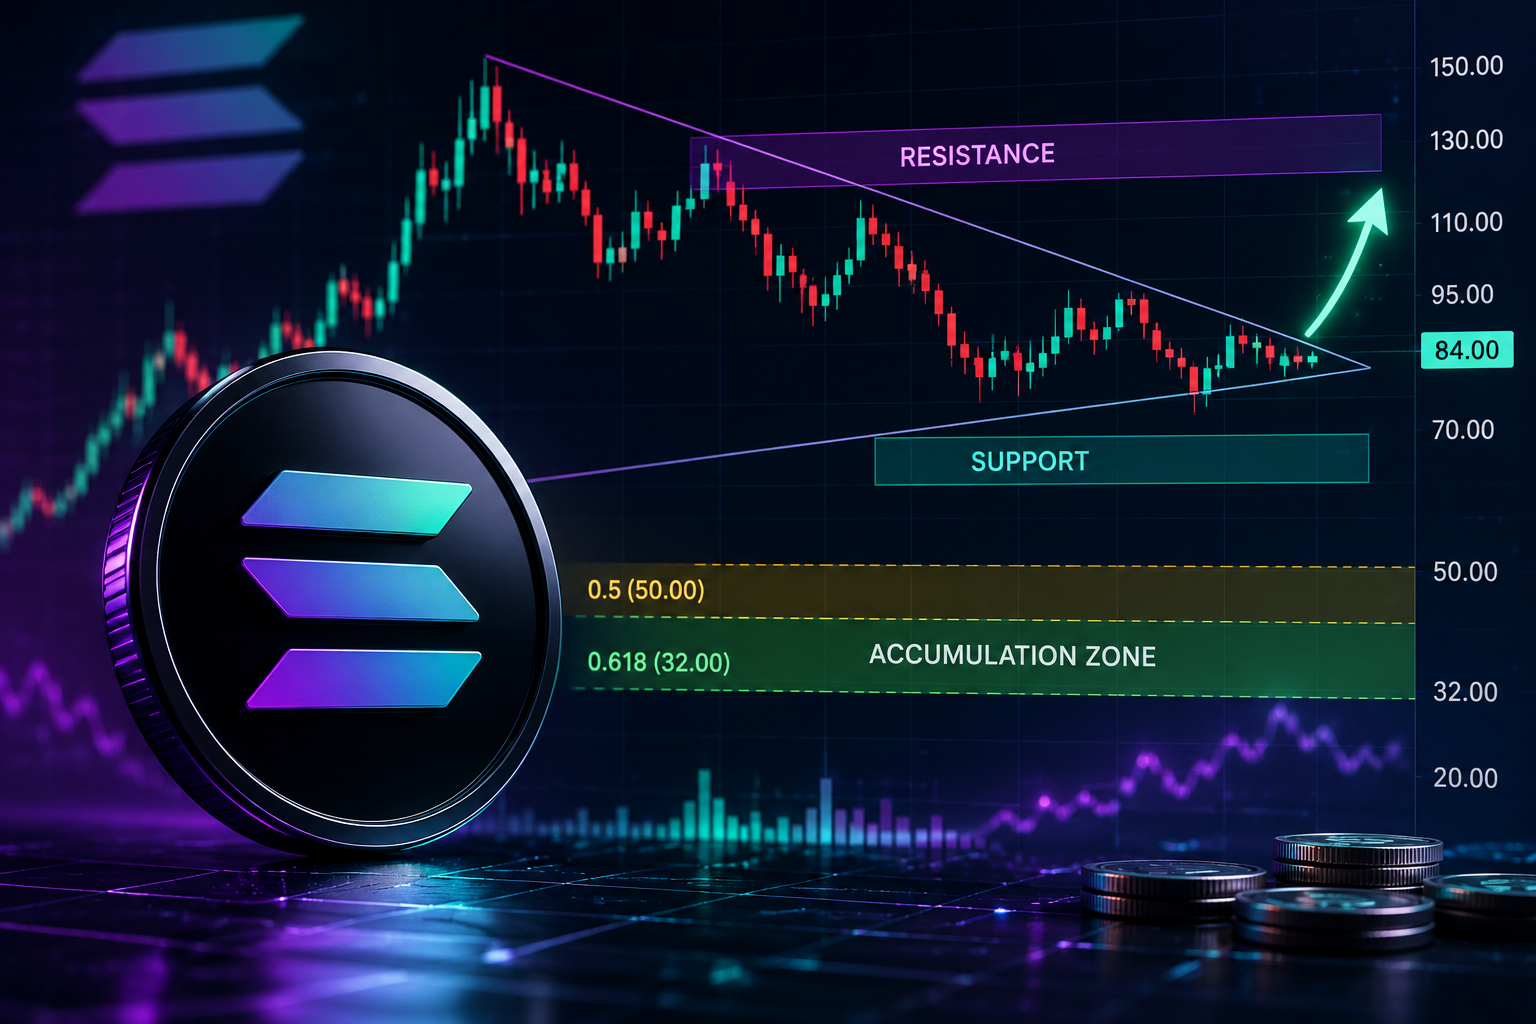
A crypto analyst shared a chart on X outlining several long-term accumulation areas for SOL. The post described the current trading range as a discounted zone compared to Solana’s all-time high. The analyst also identified the $50 to $32 range as a stronger accumulation region based on Fibonacci retracement levels. At the same time, the chart maintained a broader target near the $1,000 level over the long term.
The technical setup attracted attention as Solana continued to move inside a narrowing structure on both the daily and four-hour charts. Market participants closely followed support and resistance levels while momentum indicators remained weak.
Solana Trades Below Descending Resistance
The daily chart showed Solana trading beneath a descending resistance trendline that formed after previous highs near the $150 range. Price action remained compressed as buyers defended support around the low-$80 area. In spite of several bounce efforts, SOL did not succeed in forming a breakout to move higher above the resistance level.
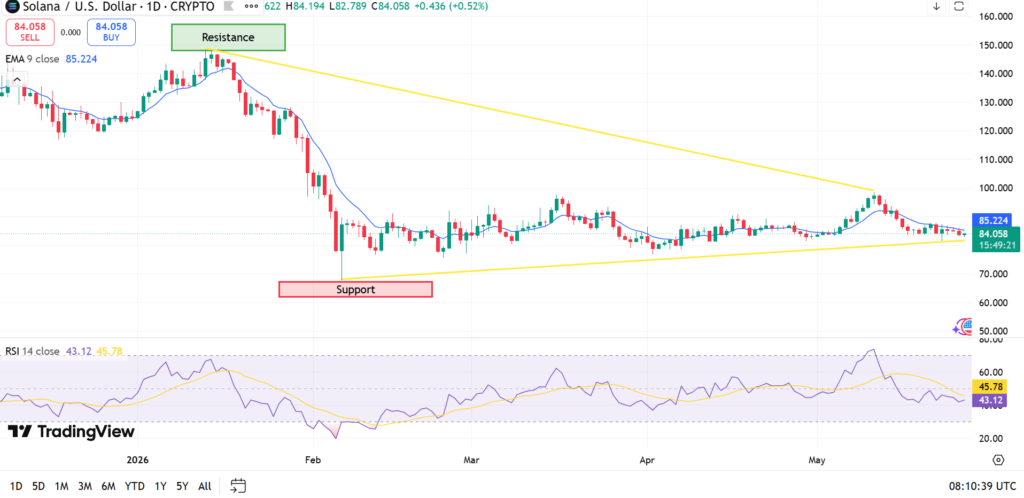
On the other hand, Solana was seen trading below the 9-day exponential moving average in the chart. The combination indicated weak short-term strength as several lower peaks had been formed recently. Furthermore, the relative strength index traded below the 50 mark.
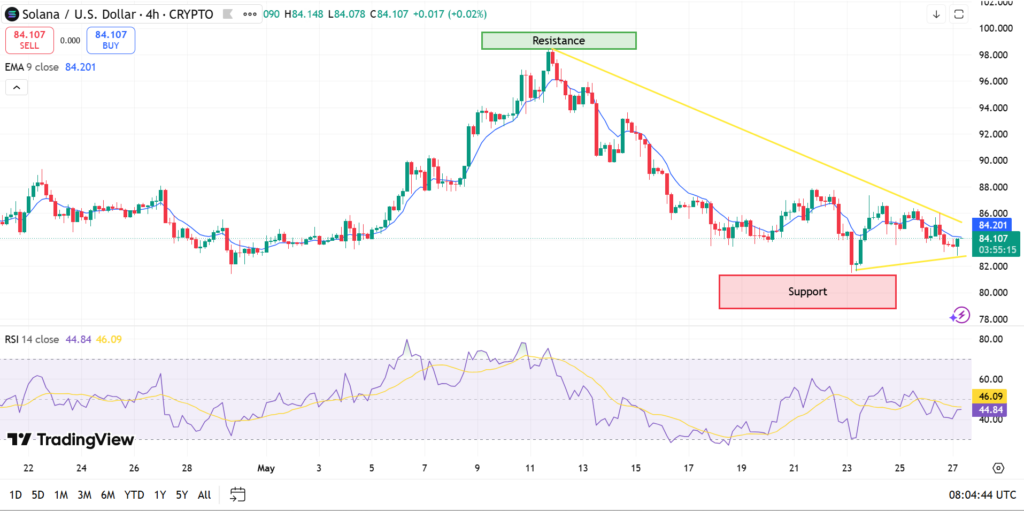
The four-hour chart presented a similar structure. Solana climbed toward the $99 area earlier in May before sellers regained control. Since then, the token has continued forming lower highs while support near the $80 to $82 region attracted repeated buying activity. Traders often monitor this type of compression pattern for a larger breakout or breakdown move.
Solana Price Prediction Focuses on Fibonacci Levels
CryptoPatel’s analysis centered on Fibonacci retracement levels tied to the broader Solana price prediction outlook. The chart identified the 0.5 and 0.618 retracement zones as possible long-term accumulation areas. According to the analysis, those levels aligned with the $50 to $32 range.
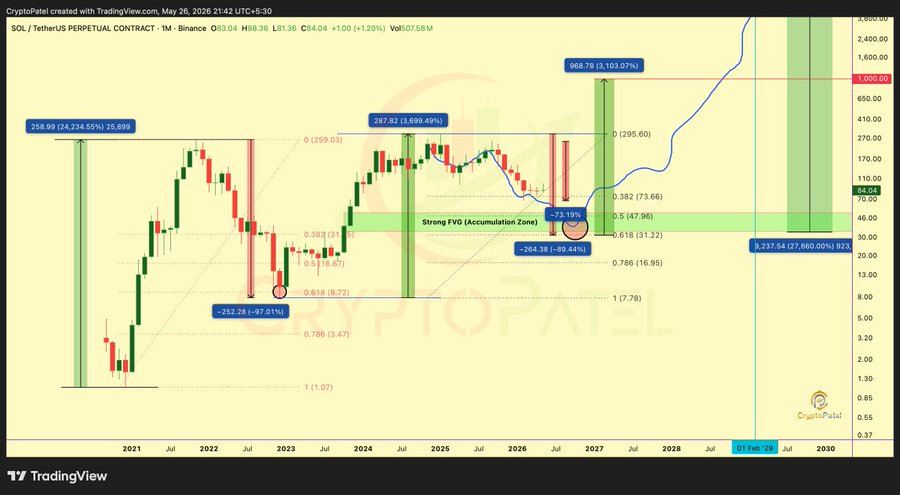
The tweet described the current $84 level as a 71% discount from Solana’s all-time high. The analyst argued that long-term investors could continue accumulating during periods of market weakness instead of chasing short-term price spikes.
The chart showed a good fair value gap accumulation zone. It is one area where traders identify zones where prices will go back again before they expand the trend. Many times, such gaps receive buying interest amid corrections in the entire market.
According to the tweet, patience was very important during the consolidation period. There was a warning against jumping into any trade based on the sentiments prevailing in the market. As a result, the analyst referred to the chart as just technical analysis only.
Support and Resistance Levels Remain in Focus
Levels of support around the $80 region were seen consistently during the ongoing consolidation process. The buyers had supported this level on multiple occasions in shorter-term frames, which had prevented further bearish movements. Nevertheless, the constant rejection at resistance continued to prevent recovery momentum.
Resistance continued to reside within the levels ranging from $95 to $100. Any break in this range could bring changes to the short-term structure, allowing Solana to break into higher resistance areas. Until then, the range continued to be narrow based on descending resistance and rising support levels.
Failure to remain above the existing support would result in a drop towards lower price regions of $70. Eventually, the breakdown would move into the levels discussed in the analysis from CryptoPatel as accumulation levels based on Fibonacci retracement. The price action was still monitored on the basis of RSI momentum and volume levels.
Overall, the narrative for Solana price predictions continued to depend upon the maintenance of higher support levels and reversal of the present lower high trend structure.