
XRP Price Prediction Turns Bearish as $1.30 Support Draws Attention
XRP price prediction turns bearish as resistance at $1.50 holds strong while on-chain data shows weakening momentum and declining transactions.
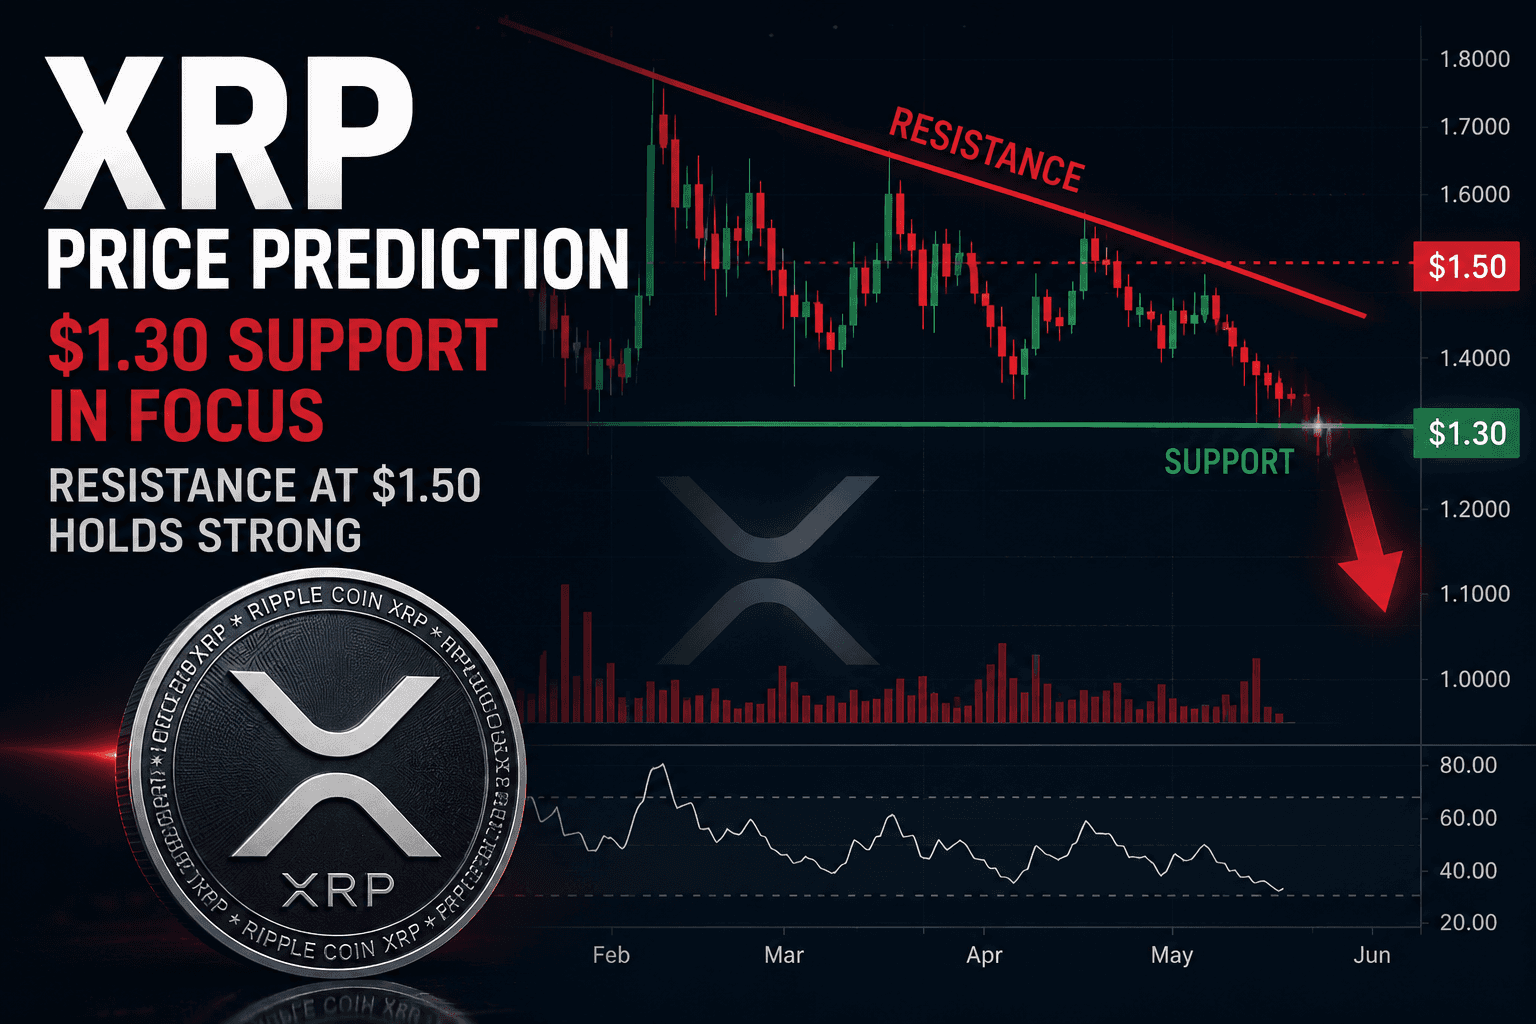
XRP Price Prediction indicated that the XRP was trading near $1.36 mark following its failure to surpass the $1.50 resistance zone. Technical analysis and metrics on the blockchain had shown signs of weakening momentum in the short, medium, and long-term periods. The next support level for the coin is estimated at $1.30.
In a tweet the accompanying charts, it was highlighted that XRP has lost its structural ascending support. Moreover, failing to break above the resistance level of $1.50 may result in a more significant drop in price.
XRP Faces Resistance Pressure on Higher Timeframes
The daily chart for XRP revealed a larger downtrend, which followed the failure of the asset to consolidate its gains beyond the $3 level in previous periods. Price was forming lower highs underneath a declining resistance trendline, while sellers were defending the upper resistance levels aggressively.

According to analysts monitoring the chart, the $2.40 to $2.60 range was seen as the significant resistance level. Price had previously tried breaking out of the range but met rejection, which forced prices lower. From the daily chart, XRP was also seen approaching an ascending support trendline that had been guiding price action since February.
The 4-hour chart offered more insights into the present price structure. XRP had broken below a rising support trendline that had been providing price guidance upwards from late April. This had shifted focus to the $1.30 support area, which is now seen as the next level of downside target.

The accompanying tweet for the charts said that the market structure is weakening. This means that failed attempts to break out of a resistance level lead to a weakening of the buying pressure in the market.

On-Chain Metrics Show Declining Network Activity
Market capitalization of XRP according to Glassnode showed a consistent decrease throughout the observed period. The market cap graph was going down from above $91 billion to below $84 billion despite a rather flat price action.

XRP transactions were decreasing. The number of transactions made using XRP fell from over 2 million to just under 1.3 million within the analyzed time frame. A decrease in transaction volume is usually an indicator of lower participation in the network and less speculation.

Active addresses showed contradictory dynamics. XRP active addresses experienced an explosive growth towards the end of the observed period despite previous decreases. Although there was a significant increase in the use of active wallets, the price did not show any signs of rising.

Traders usually look for connections between price action and blockchain data when analyzing the market strength. In this case, both decreasing market capitalization and transactions were confirming bearish signals from technical analysis.
RSI and EMA Indicators Reflect Weak Momentum
Both momentum indicators were relatively weak over the two time frames. Daily Chart, Relative Strength Index held close to neutral values and did not form any bullish divergence. It is generally taken to mean that buyers have not gained back control.
On the other hand, the 9-day Exponential Moving Average depicted a deteriorating condition. XRP was trading either at or below the moving average on many occasions. The moving average, on the other hand, had started flattening out from its prior downtrend.
4-Hour Chart’s Values of RSI held below the neutral level of the low-40 region. It meant a slight bearish dominance but no oversold condition yet. Observers of the RSI indicator expected a further move to the downside if support levels could not be sustained.
XRP Price Prediction Centers on the $1.30 Zone
The short-term XRP price prediction now centres on whether the buyers will be able to hold the support level at $1.30. Technical traders usually pay attention to such levels because of their importance for determining the future trend of the asset, either reversal or continuation of breakdown.
In case of a breakdown of $1.30 with high volume of sales, the traders may turn their attention to the next lower levels of support at $1.20 and $1.00. Breaking out from $1.40 would bring back hope for the buyers and allow moving towards the resistance level of $1.50.
At the moment of analysis, XRP stayed in the tight trading range with decreasing volumes and resistance rejection.
Final Thoughts
The current XRP price prediction is still conservative since XRP is still failing to break through the resistance line at $1.50. The focus has been drawn away from the resistance and has moved on to the next support level at $1.30 due to reduced trade volume.